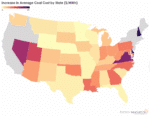
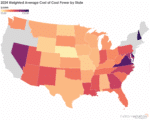
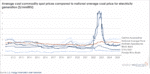
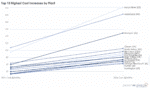
Infographic: Coal Power 28 Percent More Expensive In 2024 Than In 2021
View the Data Visualization
View the Data Visualization
View the Data Visualization
View the Data Visualization
View the Data Visualization
View the Data Visualization
Get Access
Your information will not be used for marketing purposes and we never sell your data!
All research licensed under CC BY 4.0